ThreeSixty Research Market Update November 2014

Global economies
Global equity markets staged a sharp turnaround in October - the renewed confidence resulting from both the US Federal Reserve’s reassurance that interest rate rises remain data dependant, and the positive consumer impact from lower oil prices. Also behind the positive tone was the belated, but more aggressive response to the Ebola crisis providing greater confidence that the West African virus will be contained and not lead to a global pandemic.
The impact from the geopolitical tensions in the Ukraine and the Middle East took a back seat over the past few weeks as the Coalition’s Middle East strategy quarantined the impact on equity markets.
The Bank of Japan (BOJ) announced a further extension of the existing quantitative easing - increasing by ¥30 trillion pa to ¥80 trillion pa. The BOJ response to the threat of deflation is following the US quantitative easing strategy over the past 5 years.
Chinese growth remained sluggish in October but is showing signs of stabilisation. The People’s Bank of China (PBOC) has initiated further targeted monetary stimulus. A weak property market continues to be of concern.
Eurozone manufacturing data remains weak with inflation at marginally lower levels. The European Central Bank (ECB) has provided further stimulus to the lagging Eurozone economies, with further measures expected.
There has been additional modest improvement in Australian business and consumer confidence, albeit from low levels, with further momentum across the residential construction sector.
The RBA kept the cash rate at 2.5% in November and it is anticipated that interest rates will remain at this level well into 2015. There is a likelihood of macro prudential strategies being introduced to taper growth in house prices although house price growth is slowing across the major cities.
US
Over in the US, the Fed completed the dial down of the QE3 asset purchase program in October and was more hawkish on US growth. However, it reiterated that a rise in interest rates remained data dependent.
Federal Reserve officials have stressed ‘patience’ in waiting to raise interest rates, concerned about weaker foreign economic growth and the stronger USD. It’s unlikely that interest rates will rise until mid-2015.
The US economy continues its upward trend, with Q3 GDP data coming in at 3.5%. This follows the Q2 GDP data upward revision to 4.6%, from 4.2%.
A stronger US dollar remains a feature of global currency markets. This is due to improved economic growth, the prospect of increased interest rates in 2015, the weakness in the Eurozone and Japan economies and the need by their Central Banks to provide further quantitative easing, and the weakness in commodity prices.
The services sector continued to expand, with a rise in new business volumes. The private sector has been driven by weaker energy prices, with capital expenditures improving over recent months.
Stronger non-farm payrolls data resulted in the unemployment rate declining to 5.9% in September, from 6.1% in August. Job creation has increased significantly from August; however flat hourly earnings indicate there is little to no wage inflation.
The September CPI declined marginally with the annual core CPI at 1.7%.
The US Q3 corporate earnings reporting season is well under way, with 70% of the S&P 500 companies having reported their earnings. Of those, 78% have reported earnings above their mean estimate. The earnings growth in Q3 is currently 7.3% yoy. The estimated S&P 500 corporate earnings growth in 2014 is 7% while the 2015 estimate is 10.2%.
Valuations of US companies do not seem excessive. Based on a 12mth rolling forward earnings base, the current PE multiple is 15.5 times. Interestingly, the number of companies beating estimates in the Q3 2014 corporate reporting season was the highest since Q2 2010.
Net profit margins for S&P 500 corporates have doubled over the past 5 years and have risen to over 10%. The USD has risen against most currencies over the past 12 months. With approximately 35% of US corporate earnings coming from offshore, there is some concern that a higher USD will lower translated offshore earnings.
Europe
Heading over to Europe, October data remains weak, further impacted by the geopolitical tensions in the Middle East and the Ukraine.
Importantly, the ECB stress test results were in line with expectations. An extensive health check of the region's top 130 banks provided greater transparency on the strength of the European banking industry. Impacted banks will be forced to submit remedies, including possibly raising more money from investors.
Eurozone inflation has been on a steep downward trend. In October, inflation was running at just 0.4%, up from the September 0.3%, but remains well below the ECB’s 2% target.
The UK remains on track to be the fastest growing G7 economy this year despite new figures showing a slowdown in GDP growth in Q3. Nonetheless, the UK is expected to be the fastest-growing economy among the G7 nations this year. The International Monetary Fund (IMF) predicts a GDP increase of 3.2% this year, compared with the US at 2.2% in second place.
China
Over in China, Q3 GDP was at a 5 year low, at 7.3% yoy - the slowest growth since March 2009. Consistent with this, the October PMI data was also marginally weaker (50.8) compared to the September data (51.1).
Although the PBOC has been targeting agriculture and social housing, it seems reluctant to provide broader stimulus to the economy. However, it is anticipated that the Chinese government’s monetary and fiscal policies will remain accommodative until there is a more sustained readjustment and stabilisation in economic activity across the economy.
Further to this, the PBOC recently unveiled measures designed to stimulate consumer spending, including relaxing limits on home purchases and injecting billions of dollars into the country's biggest banks.
As part of its targeted stimulus program, the PBOC reduced the interest rate on 14 day repurchase agreements and injected additional liquidity in the banking system – around RMB 200 billion to smaller national and regional lenders. This followed on from the RMB 500 billion to large banks in August. The PBOC is keen to control credit growth, particularly in over-leveraged sectors such as residential property and heavy industry.
The September core inflation of 1.6% yoy (down from 2% in August) is significantly below the targeted 3.5%. NAB Economics remains of the view that GDP in 2014 will come in at 7.3% and 7% in 2015 and 6.8% in 2016.
The growth in real estate has continued to slow. Investment slowed to 10.1% yoy in September, from 11.4% in August, the weakest growth since the GFC.
Asia region
Over in Japan, the BOJ announced a further extension of the quantitative easing.
The Central Bank expanded the size of its Japanese Government Bond (JGB) purchases to the equivalent of “about 80 trillion yen” a year, an increase of ¥30 trillion. It said it would also buy longer-dated Japan Government Bond’s (JGBs), seeking an average remaining maturity of 7-10 years.
The Central Bank also said it would triple its purchases of exchange-traded funds and real-estate investment trusts.
Turning to the global implications, additional asset purchases by the BOJ should provide further global stimulus, following the completion of the US Federal Reserve’s dial down of QE 3. The extra ¥30 trillion of annual JGB purchases would be worth around US$22 billion per month.
BOJ also added that the so-called “quantitative and qualitative easing” program would continue “as long as it is necessary.”
Japan’s inflation rate in September was at its lowest level in almost a year. Consumption continued to fall in September, while job creation weakened for the first time in over three years. The BOJ’s preferred inflation gauge slowed to 1%, the lowest in nearly a year, further diverging from the central bank’s 2% target.
Australia
Back home, the Q3 CPI confirmed that inflation remains under control in Australia. The underlying quarterly 0.5% inflation data leaves the annual pace at 2.6%. While there may be some indirect impact of the carbon tax repeal, soft domestic demand and weak wages growth are clearly driving inflationary pressures lower.
Credit growth improved to 5.2% in September. The RBA describes credit growth as ‘moderate overall’.
Total mortgage credit grew 6.7% yoy, made up of investor housing credit running at 9.2% and owner-occupier at 5.4%.
RP Data suggests Sydney prices were up +0.3% in the week ended 30 October and +11.5% YTD (11.3% previously) and Melbourne up +0.2% for the week and 8.8% YTD (8.5% previous). The auction clearance rates were very solid.
RBA officials continue to imply that some modest macro-prudential measures will be deployed in the months ahead to flatten house price growth. However, house price growth is already on the decline.
Business lending appears to be on the increase, with the Q3 2014 NAB Business survey, indicating capital expenditure is showing some improvement. Business credit, which is currently growing near 3% yoy, should be expected to grow between 4-5% in the next 12-18 months. These are early signs of a slowly improving economy.
The AiG Performance of Construction Index (PCI) expanded for the fifth consecutive month in October. Although the rate of growth slowed when compared to September, when the PIC reached a record nine year high, the residential and commercial construction sectors remain buoyant.
Australian GDP forecasts have been revised down modestly due to weaker Q3 growth and terms of trade. NAB’s GDP forecast for 2014/15 is now 2.8% (previously 2.9%), and 3.2% for 2015/16 (previously 3.4%). The unemployment rate is still expected to peak at around 6.5% by mid-2015.
NAB Economics continues to expect no change in the RBA’s cash rate until a tightening cycle begins towards the end of 2015.
Equity markets
|

Source: Factset
Following the sharp decline in September, the S&P/ASX 300 Accumulation Index rallied strongly in October, rising 4.27%. The Australian equity market benefited from the strong rise in global equities – resulting from the Ebola crisis appearing to have been contained to the West African region, the US economy continuing to improve, further quantitative easing in Japan and the prospect of an extended period of lower interest rates.
The S&P/ASX 300 Industrials Accumulation Index was also significantly higher in October, rising 5.77%.
The broader S&P/ASX All Ordinaries Index was up 3.9% in October.
For the 12 months to 31 October 2014, the S&P/ASX 300 Accumulation Index posted a solid gain of 6.07%; while the large market caps, represented by the S&P/ASX 50 Accumulation Index, had a similar performance, returning 6.43%.
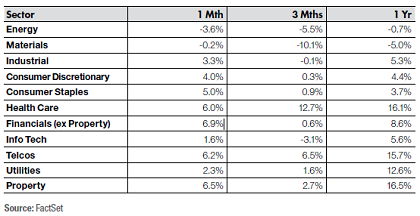
Interestingly, after poor performances across all sectors in September, sector performances significantly improved in October. Financials (ex-A-REITs), Property and Telcos were the best performing sectors, up 6.9%, 6.5% and 6.2% respectively. The Energy sector was the worst performing sector, down -3.6%.

Big movers this month
Going up: Financials (ex - Property) 6.9%
Property 6.5%
Telcos 6.2%
Going Down: Energy -3.6%
Materials -0.2%

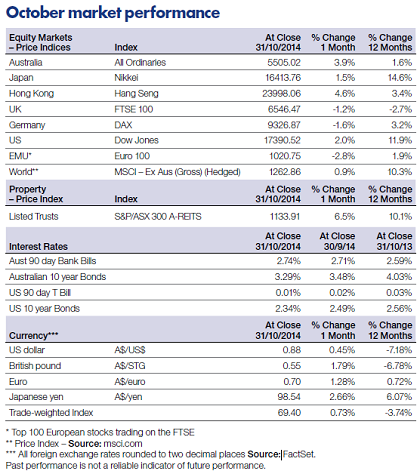
The MSCI World ex-Australia (unhedged) Index was up 0.05%, with the hedged version up 0.9%. Continuing the recent pattern, the global indices recorded extremely divergent performance for the month.
The Hong Kong Hang Seng Index was the standout performer across global markets in October, up 4.6%.
The US Dow Jones Index had a strong performance in October, up 2.0%.
The Euro 100 Index was a disappointing relative equity market performer in October, down -2.8%.
The German DAX Index had a disappointing month in October, down -1.6%.
The Japanese Nikkei Index had a strong performance in October, up 1.5%.
Over the 12 months to 31 October 2014, the Dow Jones Index was up 11.9%, the S&P 500 Index up 14.9%, the Nikkei up 14.6%, while the Hong Kong Hang Seng, the Australian All Ordinaries and the UK FTSE returned 3.4%, 1.6% and - 2.7% respectively.

In October, the S&P/ASX 300 A-REIT Accumulation Index was up 6.53%, strongly outperforming the broader Australian market as measured by the All Ordinaries Accumulation Index, up 3.96%
On a 12 month rolling basis, Australian listed property was up 16.53%, which significantly outperformed the ASX300 Accumulation Index up 6.07%
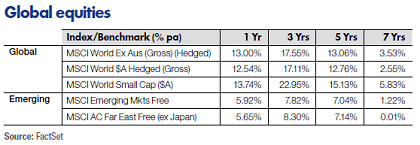
Over the 1 and 5 year periods, global REITs outperformed Australian REITs (A-REITs) but lower compared to A-REITs over the 3 and 7 years. Global property, as represented by the FTSE EPRA/NAREIT Index, was up 16.75% over the rolling one year period.

US 10-year bond yields were down -6.23% in October, closing the month at 2.3%. Australian 10-year bond yields were down -5.68% and closed the month at 3.3%.
For October, Bloomberg AusBond Composite 0+ Yr index (formerly known as the UBS Composite Bond 0+YR Index) was up 0.96%. On a 12 month basis, Australian bonds returned 7.09%, underperforming unhedged global bonds.
Global bonds (unhedged), as measured by the Barclays Capital Global Aggregate Index, posted positive returns for the one year period ended 31 October 2014, up 7.97%. The hedged index posted a strong one year gain of 7.95%.
The information contained in this Market Update is current as at 4/11/2014 and is prepared by GWM Adviser Services Limited ABN 96 002 071749 trading as ThreeSixty Research,registered office 105-153 Miller Street North Sydney NSW 2060. This company is a member of the National group of companies.
Any advice in this Market Update has been prepared without taking account of your objectives, financial situation or needs. Because of this you should, before acting on any advice,consider whether it is appropriate to your objectives, financial situation and needs.
Past performance is not a reliable indicator of future performance.
Before acquiring a financial product, you should obtain a Product Disclosure Statement (PDS) relating to that product and consider the contents of the PDS before making a decision about whether to acquire the product.


