
ThreeSixty Research Market Update June
MAY MARKET PERFORMANCE
The Pulse
|
Global economies
The May Purchasing Managers Index (PMI) survey data continues to show gradual improvement in the growth rate of global manufacturing. However, the growth rate remains below trend. Interestingly, the pace of job creation increased across the US and the Eurozone.
The US continues to be a key driver of global growth and is gradually recovering from the weaker growth rate through Q1 2015. The recent data indicates that exports are being impacted by the stronger US dollar.
The Eurozone recovery continued in May with Italy and Spain showing considerable growth rate improvement.
China has maintained its monetary stimulus strategy with further interest rate cuts in May.
The RBA maintained the cash rate at 2% at its June meeting and indicated that it retains an easing bias.
US
Although the data has been a little mixed, the May manufacturing Institute of Supply Management (ISM) data was considerably stronger (52.8) compared to April (51.5) and particularly relative to the weak Q1 weather related data.
US April construction spending data was up 2.2% month-on-month and with a further upward revision in March.
The consumer spending data was flat in April compared to the 0.5% increase in March.
Interestingly the closely watched core Personal Consumption Expenditures Index (PCE) deflator, excluding food and energy, was weaker in April at 1.2% year-on-year (yoy), down from 1.3% in March.
On the other hand, the broader based US April core CPI was steady at 1.8% yoy compared to March. The past 3 months CPI has been running at 2.6% annualised.
Business activity continued to rise at a relatively strong rate across the US service sector in May, but the latest survey indicated a slight loss of momentum since April. However, the data provided further evidence that the rate of expansion has picked up from the weak start to the year.
Federal Reserve Chair, Janet Yellen, reiterated earlier statements with the comments that the first step towards policy normalisation of interest rates would occur later in 2015.
The Q1/2015 GDP was revised down to -0.7% from 0.2% previously.
The S&P/Case Shiller composite price index of 20 metropolitan areas gained 5.0 yoy in March. Since the March 2012 lows, house prices have recovered 30.7% reflective of a stronger US economy.
The Q1 2015 S&P 500 earnings growth estimate is expected to come in at 0.7%. This compares to the estimate at 31 March 2015 of -4.6%. The market will continue to focus on management commentary regarding the outlook and impact on earnings and revenues of slower global economic growth, lower oil and gas prices, and the stronger USD.
The US 2015 earnings growth has been lowered to 1.7% (revenues to – 1.8%) while the 2016 estimated earnings growth is at 12.0% (revenue growth at 5.6%). The current 12-month forward Personal Earnings (P/E) ratio is 16.9 based on a forward 12-month Earnings Per Share (EPS) estimate.
Europe
Over to the Eurozone, the growth in the May PMI manufacturing sector has maintained the recovery seen in April. Signs are emerging that the European Central Bank’s (ECB) US$60b quantitative easing program is initiating improvement in the economy.
The PMI survey also showed that the rate of expansion remained sufficiently robust to encourage firms to take on extra staff at the fastest rate for four years.
The PMI data also brought some encouraging news with price pressures reaching three-year highs.
The weakness in the Euro is also helping manufacturers and this is expected to continue through 2015.
Spain and Italy particularly benefited from improved export performances.
China
In China, the People’s Bank of China (PBoC) continued to provide stimulus to the slowing economy and cut interest rates for the third time in six months.
The benchmark one-year lending rate was lowered by 25 basis points (bp) to 5.1%, while the deposit rate was cut by the same amount to 2.25%. Despite the cuts to lending rates, these are yet to fully flow through to average rates for borrowers – with some loans adjusted annually. It is anticipate the PBoC will make further interest rate cuts across 2015.
China’s manufacturing business activity (PMI) was slightly higher in May (50.2) compared to April (50.1). Non-manufacturing PMI posted a 53.2, up from 53.4 in April. These numbers highlight a still expanding economy.
Asia region
Over to Japan, PMI indicated an improvement in operating conditions in the Japanese manufacturing sector.
Consumer prices in Japan rose 0.6% yoy in April, slowly increasing as the effects of declines in oil prices dicipate.
The Indian economy continued to improve in May with the HSBC Manufacturing data (52.6 compared to 51.3 in April) showing solid gains.
As indicated in May, the International Monetary Fund (IMF) expects the Indian economy to more than double in size in the 10-year period finishing in 2019. India's growth came in at 7.2% in the financial year ending in March 2015. This is expected to accelerate further to 7.5% this financial year. As indicated, India will be the fastest-growing large economy in the world in 2016.
Australia
Back home, the Reserve Bank of Australia (RBA) kept the cash rate at 2.0% at its early June meeting. The RBA remains data dependent however the bias remains on the easing side. The current cash rate or lower rates are expected to continue well into 2016.
Australia's PMI rose by 4.3 points to 52.3 points, following 5 months of sub-50 readings. The Australian May PMI is equal to or higher than comparable PMI readings in the Eurozone (52.3), Japan (50.9) and China (49.1), although it still lags the US (53.8). Nevertheless, this survey shows the first evidence from the suite of business surveys in Australia that export sales have begun to respond to the weaker Australian dollar (AUD), with the export index surging 10.9pts in May to 58.3pts to be well above the 12 month average of 51pts.
The RBA May Statement on Monetary Policy (SoMP) is not expecting above trend growth until 2016/ 2017. Current unemployment levels are not expected to decline until 2016/ 2017. Interestingly, the RBA reduced its CPI Inflation forecast in the period to 2017, remaining relatively benign and at the lower end of the 2% - 3% target range. The RBA’s underlying inflation forecasts remain in the 1% - 2% range, until 2017.
The May Federal Budget confirmed the Commonwealth’s fiscal position is under both cyclical and structural pressure. Weaker revenues on the back of the lower terms of trade and a cyclically-soft economy are the main near-term factors. The budget is expected to remain in deficit until 2020. The focus in the budget was on turning around the negative political outcomes from the previous year, with emphasis on child care, pensions, small business and no changes to superannuation legislation which is seeking to improve sentiment.
Building approvals were down 4.4% in April but an upward trend remains with the yoy figure up 16.3%. There remains a big pipeline for development of unit approvals especially to drive residential investment in the year ahead. So far this year total dwelling approvals have been running at a 231,200 annual rate up from last year’s total of 203,200.
Credit growth was up 0.3% month-on-month (mom) in April and up 6.1% yoy. This monthly credit growth was driven by continued strong housing credit growth, up 0.5% mom and 7.2% yoy. Investor housing credit slowed marginally to 0.8% mom in April (10.4% yoy), with the yoy remaining the strongest since early 2008. The monthly figure of 0.8% mom annualises at 9.8%, which is at APRA’s 10% investor credit growth guidance.
Business credit growth slowed again in monthly terms (0% mom and 5.0% yoy). The trend increase in business credit remains and is consistent with an emerging but relatively slow recovery in non-mining investment. The slow recovery in non-mining investment was highlighted in the Capex survey which showed non-mining investment plans not improving, but at the same time not substantially deteriorating either.
Evidence is emerging that the housing price growth in Sydney and Melbourne is waning. CoreLogic RP Data shows Australian home prices were down 0.9% in May compared to 0.8% in April. Prices were up 9.0% yoy. On a year to date basis, prices were up 2.9% across the eight capital cities, Sydney was down 0.7% in May and up 15.0% yoy while Melbourne was down 1.7% in May and up 9.0% yoy.
Equity markets
|
Australian equities
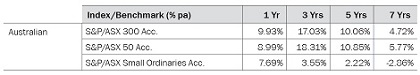
The S&P/ASX 300 Index was down 0.18% in May while the S&P/ASX 300 Accumulation Index was up 0.43%. The 12 month return on the S&P/ASX 300 Index was 5.2% while the 12 month return on the S&P/ASX 300 Accumulation Index was 9.9%. The RBA decision to cut the cash rate to 2.0% helped specific sectors. These included selective Industrial securities, Information Technology, Materials, Healthcare and Australian Real Estate Investment Trusts (A-REIT).
The S&P/ASX 300 Industrials Index was down 0.32% in May, while the S&P/ASX 300 Industrials Accumulation Index was up 0.4%. The 12 month S&P/ASX 300 Industrials Accumulation Index was up 14.9%.This strong 12 month result reflected the strong returns from the Healthcare, A-REITs, Telcos and Utilities sectors while the Energy sector, down 14.8%, detracted from the returns.
The broader S&P/ASX All Ordinaries Index was flat in May and on a 12 month basis, the Index was up 10.1%.
The large market caps represented by the S&P/ASX 50 Index underperformed, down 0.73% in May and on a 12 month basis the Index was up 4.1%. The S&P/ASX 50 Accumulation Index was up 9.0% in the 12 months ending 31 May 2015.
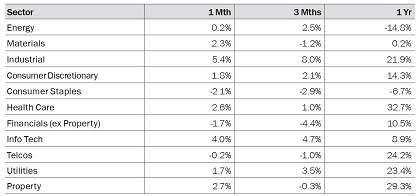
Again, in May, the ASX sectors were quite divergent. The Industrials sector had a strong monthly return with a 5.4% rise. Information technology and A-REIT’s also had strong monthly returns, up 4.0% and 2.7% respectively. On the negative side, the Consumer Staples were down 2.1% while the Financials (ex A-REITs) continued its decline, down 1.7% and follows the April decline of 4.7%.
|
Big movers this month | ||
|
Going up: |
Industrials 5.4% | |
|
Information Technology 4.0% | ||
|
A-REIT 2.7% | ||
|
Going Down: |
Consumer Staples -2.1% | |
|
Financials (ex Property) -1.7% | ||
|
Telcos - 0.2% | ||
Global equities
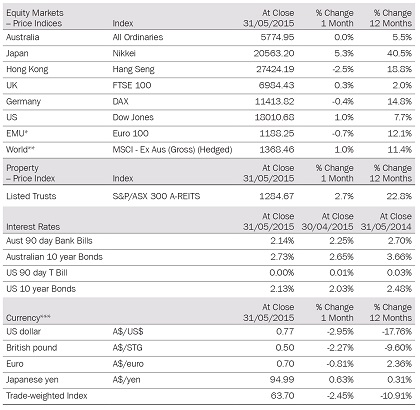
Global equity markets had another divergent performance in May, with the Japanese Nikkei up strongly at 5.3%. On the other hand, the Hong Kong Hang Seng was down 2.5%. The US markets were also higher with the Dow Jones up 1.0% while the S&P 500 was up 1.1%. The European markets were generally down, namely Germany (-0.4%) and France (-0.5%). The China Shanghai Composite Index was up 3.83% in May.
Over the 12 months to 31 May 2015, the best performers were the exceptionally strong Asian markets. The Shanghai Composite Index, the Nikkei and the Hang Seng, were up 126%, 40.5% and 18.8% respectively. On the other hand, the underperformers over the 12 month period were the S&P 500 Index, up 9.6%, the Dow Jones Index up 7.7%, the Australian All Ordinaries, up 5.5% and the UK up 2.0%.
Property
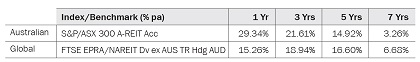
The S&P/ASX 300 A-REIT Index was up 2.7% while the 12 month return was 22.8%. The S&P/ASX 300 A-REIT Accumulation Index’s was up 2.7% in May. The index outperformed the broader Australian market, as measured by the All Ordinaries Accumulation Index that was flat in May.
On a 12 month rolling basis, the Australian listed property market, as measured by the S&P/ASX 300, A-REIT Accumulation Index was up 29.3%, which significantly outperformed the ASX300 Accumulation Index that was up 9.9%.
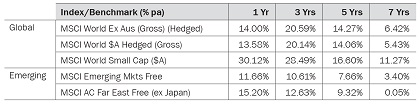
Over 1 and 3 years, the A-REITs outperformed global REITs while this was reversed over a 5 and 7 year period. Global property, as represented by the FTSE EPRA/NAREIT Index, was up 15.26% over the rolling 1 year period.
Fixed interest
In May, US 10 year bond yields were up 4.53% and closed the month at 2.13%. Australian 10-year bond yields were 3.1% higher, and closed the month at 2.73%.
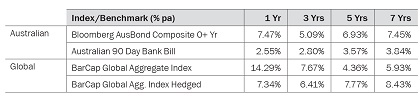
For May, Bloomberg AusBond Composite 0+ Yr index (formerly known as the UBS Composite Bond 0+Yr Index) was up 0.04%. Global bonds (unhedged), as measured by the Barclays Capital Global Aggregate Index, posted a 1.20% increase in May.
On a 12 month basis, the unhedged global bonds index returned 14.29%, outperforming Australian bonds that returned 7.47%.The hedged global bonds index posted a strong one year gain of 7.34%.
Australian dollar
The AUD gave back some of the April gains as the RBA cut the cash rate to 2.0% and general economic data was weaker in May.
In May, the trade weighted index (TWI) was down 2.5% and down 10.9% in the 12 month period to 31 May 2015.
The AUD declined 3.0% against the USD in May, to finish the month at 77 US cents. On a 12 month basis, the AUD declined 17.8% against the USD.
The AUD declined against the Euro, down 0.81% in May. On a 12 month basis, the AUD was up 2.4% against the Euro.
Against the Japanese Yen, the AUD was up 0.63% in May. On a 12 month basis, the AUD was up 0.31% against the Yen.
Against the British Pound, the AUD was down 2.3% in May. On a 12 month basis, the AUD was down 9.6% relative to the British Pound.
The information contained in this Market Update is current as at 06/05/2015 and is prepared by GWM Adviser Services Limited ABN 96 002 071749 trading as ThreeSixty Research, registered office 105-153 Miller Street North Sydney NSW 2060. This company is a member of the National group of companies.
Any advice in this Market Update has been prepared without taking account of your objectives, financial situation or needs. Because of this you should, before acting on any advice, consider whether it is appropriate to your objectives, financial situation and needs.
Past performance is not a reliable indicator of future performance. Before acquiring a financial product, you should obtain a Product Disclosure Statement (PDS) relating to that product and consider the contents of the PDS before making a decision about whether to acquire the product.