
ThreeSixty Research Market Update August

The Pulse
|
Global economies
Global equity markets recovered a significant amount of the June decline, as the Greece debt crisis and the China Shanghai Composite Index stabilised in the latter part of July.
US economic data has continued to be resilient, with an upward revision of the Q1 Gross Domestic Product (GDP) data to zero, while Q2 GDP came in at 2.3%.
The Eurozone economic recovery continued, with positive signs of improved consumer spending.
China Q2 GDP of 7% meets the country’s 2015 growth target.
The Reserve Bank of Australia (RBA) maintained the cash rate at 2% at its August meeting and retains an accommodative policy.
US
In the US, recent data remains positive. Although the headline number for the July manufacturing Institute of Supply Management (ISM) data was a little lower relative to June, the underlying data was positive. The data continued to illustrate the positive tone of the US economy. July data of 52.7 followed the results of 53.5 in June, 52.8 in May and 51.5 in April. Importantly, new orders were higher, together with the Production Index which was up 2% on the 54% recorded in June.
The ISM services Sector Index rose to 60.3, its highest reading since August 2005, indicating a positive tone across the non-manufacturing sector.
The growing expectation is that the US Federal Reserve will raise interest rates later in 2015 or in early 2016. A continuation of positive economic growth and continued positive employment data add further support to this strategy.
The US 2015 corporate earnings growth remains steady at 1.5% (revenues to – 2.1%), while the 2016 estimated earnings growth remains steady at 11.9% (revenue growth at 5.8%).
The current 12 month forward Price/Earnings (P/E) ratio is 16.6 times. This is above the 5 year average of 13.9 times, and the 10 year average of 14.1 times.
Europe
Over to the Eurozone, the Greece crisis continued to be a focus for investors. The successful negotiations between the Greek Government, European Economic Commission (ECB) and International Monetary Fund (IMF) to reach a satisfactory outcome, have been positively received by investors.
Growth of retail sales in the Eurozone accelerated in July, reflecting acceleration from Germany, France and Italy. The July Eurozone retail Purchasing Managers’ Index (PMI) showed sales growth accelerated sharply. The German data was particularly strong, recording an increase in sales which was the fastest since late-2006.
The final Markit Eurozone PMI Composite Output Indexposted 53.9 in July, down from 54.2 in June. Solid expansions of output were signalled across both the manufacturing and service sectors, with a slightly faster rate of growth from service providers.
Spain registered the best rate of economic growth of the ‘big-four’ Eurozone nations. Growth in Germany remained solid and steady, whereas decelerations were signalled in both France and Italy.
China
In China, the manufacturing PMI data decreased slightly to 50 in July, from 50.20 in June. This followed the continued actions from the People’s Bank of China (PBoC) to further stimulate the economy through interest rate cuts in June.
However, a reading of China's services sector showed a quick pace expansion in July. The Caixin China services PMI data for July rose to 53.8, up from June's 51.8, and represented the highest reading since August 2014. This follows the Q2 2015 GDP data which came in at 7% Year Over Year (YOY).
Although the Chinese stock markets remain volatile, the Government’s strategy in June to manage volatility has had a positive short-term impact. Government controls on the stock markets remain in place - these include brokerage companies and fund managers buying considerable amounts of stocks and having restrictions on selling stocks. China has also orchestrated a halt to new share issues, with 28 Initial Public Offerings (IPOs) being placed on hold.
The inflation data continues to be subdued – the June inflation number was 1.4% and is expected to remain well below the target inflation number of 3.5%, when the July number is released.
The benchmark interest rate of 4.85% provides considerable opportunity for the PBoC to cut interest rates further, in order to meet the current economic growth objectives of ‘hitting around 7%’ in 2015.
Asia region
Over to Japan, the manufacturing PMI increased to 51.20 in July, from 50.10 in June. The Markit/Nikkei Japan services PMI fell to a seasonally adjusted 51.2 in July, from 51.8 in June.
The Bank of Japan (BoJ) has stated that the country’s economy would expand 1.7% in the fiscal year to March 2016, while inflation would come in at 0.7%. This was down from 2.0% and 0.8% respectively, estimated earlier this year. The BoJ stated that the economy was "expected to continue recovering moderately”.
Given the low inflation data against a 2% target, it is expected that the BoJ will commence further easing policies later this year.
India July manufacturing business conditions continued to improve. There was a solid increase in new orders. Growth of both domestic and foreign demand increased. The seasonally adjusted Nikkei India Manufacturing PMI was consistent, with a solid improvement in the health of the country’s goods producing sector.
As indicated in July, the IMF expects the Indian economy to more than double in size within the 10 year period finishing in 2019. According to NAB Economics, India's growth is expected to come in at 7.8% in CY2015 and 8% in CY2016, compared to China’s forecasted growth of 7.1% in 2015 and 6.9% in 2016.
Australia
Back home, the RBA kept the cash rate at 2.0% at its early August meeting. The RBA continues to focus on the ongoing data but retains an accommodative policy. It’s expected that the cash rate at current or lower levels will continue well into 2016.
RBA credit growth in June eased slightly to 5.9% YOY, from 6.2% in May YOY. Housing credit growth remained steady at 0.6% Month Over Month (MOM). Steady housing credit growth was represented by a consistent owner – occupied credit growth at 5.5% YOY. Investor housing credit growth increased to 10.7% YOY, from 10.6% in May YOY.
Given the regulators’ concerns over the rise in house prices, it is no surprise that lending institutions have begun raising interest rates and lending requirements for investors in the housing market.
Business credit growth was down in June. Annual business credit growth was 4.3% YOY, down from the 5.1% in May YOY.
Building approvals show that the number of dwellings approved fell 1.2% in June 2015, in trend terms, and have continued to fall for four straight months.
Australian house price growth has remained strong in July (+2.8% MOM). The CoreLogic RP July data saw stronger house price growth in Melbourne (+4.9% MOM) and Sydney (+3.3% MOM). On a YOY basis, Sydney is up 18.4%, while Melbourne is up 11.5%. Combined, capital cities are up 11.1% YOY in July. Apart from Sydney and Melbourne, annual growth rates across the other capital cities were relatively subdued.
The RBA released its August 2015 ‘Statement of Monetary Policy’ and indicated that an”accommodative stance of monetary policy” remains appropriate. GDP growth is expected to be between 2% - 3% by June 2016, and surpass 3% by June 2017. Interestingly, inflation is forecasted to remain within the target range of 2% – 3% in the year ending December 2017.
Equity markets
|
Australian equities

Both the S&P/ASX 300 Index and S&P/ASX 300 Accumulation Index were up 4.3% in July. The 12 month return on the S&P/ASX 300 Index was 1.04%, while the 12 month return on the S&P/ASX 300 Accumulation Index was up 5.5%.
The S&P/ASX 300 Industrials Index was up 5.5%, while the S&P/ASX 300 Industrials Accumulation Index was also up 5.5% in July. The 12 month S&P/ASX 300 Industrials Accumulation Index was up 12.97%. This strong 12 month result reflected strong returns from the Healthcare, Telcos, Property and Utilities sectors.
The broader S&P/ASX All Ordinaries Index was up 4.2% in June, and on a 12 month basis this was up 1.0%.
The large market caps represented by the S&P/ASX 50 Index outperformed, up 4.9% in July, and over 12 months this was up 0.88%. The S&P/ASX 50 Accumulation Index was up 4.4% in July, and during the 12 months ending on 30 July 2015 this was up 5.58%.
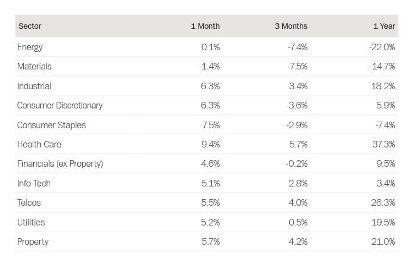
Most sectors reversed the sharp sell-off from June. The Healthcare sector was the best performer, up 9.4%, while Materials was the worst performer, down 1.4%. Consumer Staples, Consumer Discretionary and Industrial sectors were also up strongly, 7.5%, 6.3%, and 6.3% respectively.
Global Equities
The resolution of the Greece debt crisis resulted in a sharp rise in the Eurozone equity markets. The Euro 100 was up 4.9% in July, while the German DAX market was up 3.3%. However, the standout performer was the French CAC40 Index which was up 6.1%.
The Japanese Nikkei was up 1.7% in July, reflecting the continued strong corporate earnings on the back of a continued weak Yen.
The US markets also performed well, with the S&P 500 up 1.97%.
The China Shanghai Composite Index was down 14.34% in July.
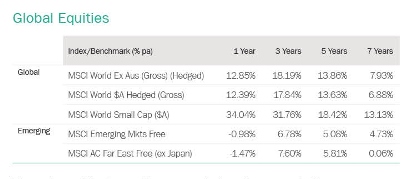
Over the 12 months ending on 30 July 2015, the best performers were the exceptionally strong Asian markets, while Germany also performed well. The Shanghai Composite Index, the Nikkei and the German DAX were up 66.4%, 31.8% and 20.2% respectively. On the other hand, the underperformers over the 12 month period were the UK and the Nikkei Indices, down 0.5%, the Australian All Ordinaries, up 1.0%, and the Dow Jones Index up 6.8%.
Property
The S&P/ASX 300 A-REIT Index was up 5.65% in July, while the 12 month return was 16.1%. The S&P/ASX 300 A-REIT Accumulation Index’s was up 5.67% in July. The S&P/ASX300 AREIT Accumulation Index performed better compared to the broader Australian market, as measured by the All Ordinaries Accumulation Index which was up 4.23% in July.
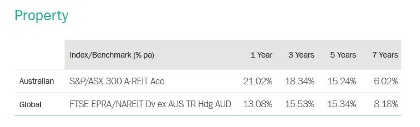
Over 12 months, the Australian listed property market, as measured by the S&P/ASX 300 A-REIT Accumulation Index, was up 21.02%, which significantly outperformed the ASX300 Accumulation Index which was up 5.51%.
Over 1 and 3 years, the A-REITs outperformed global REITs, which was the opposite over the5 and 7 year periods. Global property, as represented by the FTSE EPRA/NAREIT Index, was up 13.08% over a 1 year period.
Fixed Interest

In July, the US 10 year bond yields were down 7.2%, and closed the month at 2.18%. Australian 10 year bond yields were down 8.3%, and closed the month at 2.76%.
Over a 12 month period, the unhedged global bonds index returned 18.96%, outperforming Australian bonds which only returned 6.69%.The hedged global bonds index posted a strong 1 year gain of 6.40%.
|
Big movers this month | ||
|
Going up: |
Health Care + 9.4% | |
|
| ||
| Going Down: |
Materials -1.4% | |
Australian dollar (AUD)
In July, the Trade-weighted Index was down 3.76%, and also down 14.13% during the 12 month period ending on 31 July 2015.
The AUD was down 4.46% against the USD in July, to finish the month at 73 US cents. On a 12 month basis, the AUD declined 21.01% against the USD.
The AUD declined against the Euro, down 3.65% in July. On a 12 month basis, the AUD was down 4.34% against the Euro.
Against the Japanese Yen, the AUD was down 3.26% in July. On a 12 month basis, the AUD was down 4.84% against the Yen.
Against the British Pound, the AUD was down 3.71% in July. On a 12 month basis, the AUD was down 14.54% relative to the British Pound.
The information contained in this Market Update is current as at 6/8/2015 and is prepared by GWM Adviser Services Limited ABN 96 002 071749 trading as ThreeSixty Research, registered office 105-153 Miller Street North Sydney NSW 2060. This company is a member of the National group of companies.
Any advice in this Market Update has been prepared without taking account of your objectives, financial situation or needs. Because of this you should, before acting on any advice, consider whether it is appropriate to your objectives, financial situation and needs.
Past performance is not a reliable indicator of future performance. Before acquiring a financial product, you should obtain a Product Disclosure Statement (PDS) relating to that product and consider the contents of the PDS before making a decision about whether to acquire the product.